
Page 54 - Build 153
P. 54
Hazards
available. The highest exposures by region are in Canterbury, Hawke’s Bay, Waikato (roads especially), Wellington and Otago.
Key ndings for residents and buildings:
● OftheregionswithLiDARdatasetsavailable,two-thirdsofpeople
living in 0–1.5 m coastal elevation zones (from 2013 Census) are in:
● Canterbury (23%)
● Hawke’s Bay (19%)
● Bay of Plenty (13%)
● Auckland (12%).
● The main concentration of populations in these low-lying elevation zones are in urban areas or settlements.
● Canterbury and Hawke’s Bay, followed by Waikato (mainly Hauraki- Coromandel), have the most buildings of all types in the 0–1.5 m elevation zone. The Bay of Plenty and Wellington, including Lower Hutt, join this group with the highest building counts across the wider 0–3 m elevation zone.
● Dunedin (2,683), Napier (1,321) and Christchurch (901, excluding the red zone) have the most dwellings in the vulnerable lowest elevation band less than 0.5 m above spring tide mark.
● Canterbury, Auckland, Wellington and Hawke’s Bay regions dominate the building replacement cost national totals (using construction unit costs with oor area estimates in RiskScape). Across all areas
with LiDAR available, the total replacement cost for all buildings is $19 billion (2011) on land below 1.5 m and rises to $52 billion for land below 3 m.
Local councils need to ne-tune risks
This type of national coastal census does not necessarily mean that these people and assets will be directly a ected. However, it does mean they will potentially be exposed to coastal hazards and sea-level rise over di ering timeframes – with lower elevation bands more likely to be impacted in the shorter term.
More in-depth regional or local studies by councils are required to demonstrate the likely risk to buildings and residents for speci c scenarios of coastal hazards and sea-level rise over various timeframes. This information and mapping will then provide a more robust evidence base for engaging with potentially a ected communities.
The Parliamentary Commissioner for the Environment report does, however, broadly indicate the extent of risk exposure nationally. It also shows which regions or urban areas are more at risk from rising seas in conjunction with coastal inundation hazards from storms or tsunamis.
For more Visit www.pce.parliament.nz/publications and then Preparing New Zealand for Rising Seas.
BUILDINGS
AFFECTED
$19 billion
to replace all buildings (2011)
68,170
buildings total
43,680
homes
133,265
people in homes
83 km
10 km
169 km
15 km
16,062
2,761
133 km
14 km
769 km
37 km
169 km
3 km
5 km
4,700
16,918 3,633
5 km
9 km
E
11,399
10,284
5,483
4 km
24,747
8,740
19 km
30,580
291 km
10 km
5 km
12,595
3,957
174 km
4 km
13 km
KEY
Population
Residential buildings
Local
Arterial
Roads
Rail
Airport
NATIONAL
INFRASTRUCTUR
382
critical-facility buildings
5
airports
1,547
jetties and wharves
2,121 km
of roads (1,930 km local)
46 km
of railway
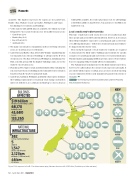
Figure 1: Risk exposure in the 0–1.5 m above mean spring tide zone for areas with LiDAR data (Canterbury excludes red zone).
52 — April/May 2016 — Build 153
FEATURE SECTION
