
Page 52 - Build 152
P. 52
Ventilation
timber moisture content (%)
10.0 12.5 15.0
17.5 20.0 22.5
25.0
4
3
2
1
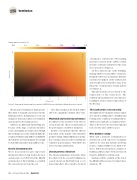
Figure 2: Heatmap of framing moisture content in BRANZ research building sub oor when vents closed.
N
123456789
distance (m)
a heatmap or contour plot of the framing moisture contents in the subfloor when moisture contents peaked before the vents were opened (see Figure 2).
On the southern side of the building, framing timbers reached bre saturation, though the e ect was not uniform. Moisture contents were highest on the southern side and steadily lowered further away from this point – it radiated in a circular pattern (see Figure 2).
This phenomenon was related to the temperature of the rooms above. The southern side had much less solar exposure, resulting in a lower surface temperature of the ooring.
Thorough subfloor check needed
The implication for industry is that a simple spot check crawling under a building and looking at the condition of framing timbers will not necessarily give a complete picture. There is the need to be more thorough and look over the entire sub oor space.
More guidance coming
With such a dramatic accumulation of moisture in a well exposed, rectangular sub oor, it’s clear that moisture problems in more con ned sub oors are likely to be worse. When the oorplan is complex or building additions have blocked vents o , it may be di cult to ventilate well.
Guidance will be available at the end of the BRANZ sub oor project to help in these situations.
The measured ventilation is much greater than what is typically experienced in the living space above. In living spaces, even 1 air change per hour can result in overventilation and energy loss becoming an issue.
Sub oors are di erent from the living area because of the large, consistent moisture source and smaller air volume. Even though the air change rate seems relatively high, the results in Ventilation and sub oors in Build 149 show that the test vent opening is not enough to deal with evaporation from sub oor soils.
Results informing models
These measurements give important information that is being used in the heat and moisture tool WUFI and the BRANZ nodal model of this building to establish the evaporation rate from the soil.
Once this is nalised, the models will be able to be expanded to include extra vents.
Wind wash and insulation performance
In addition to the moisture work, there is research into the e ects of wind wash on the performance of sub oor insulation.
Results so far indicate that the e ect is dependent on the density of the insulation product. Simply adding slightly more insula- tion or using a denser product can limit any reduction in performance. This will be the focus of a future Build article.
Uneven patterns of moisture
The rapid accumulation of moisture when the sub oor in the research building was sealed (shown in Build 149) had a very interesting e ect. More detail is shown in
50 — February/March 2016 — Build 152
FEATURE SECTION
distance (m)
