
Page 51 - Build 152
P. 51
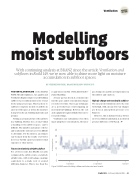
Modelling moist sub oors
With continuing analysis at BRANZ since the article Ventilation and sub oors in Build 149, we’re now able to shine more light on moisture accumulation in sub oor spaces.
BY STEPHEN MCNEIL, BRANZ BUILDING PHYSICIST
Ventilation
THE VENTILATION RATE of the BRANZ WAVE (Weathertightness, Air quality and Ventilation Engineering) research building sub oor was recently monitored for several weeks using a tracer gas. This was done to calibrate computer models of air ows in and out of the space as well as the moisture transport in the air, building materials and ground.
Getting an accurate picture of the air ows in a building, whether it is a room, behind a cladding or the subfloor space, can be di cult. The number and nature of holes and cracks in the enclosure are very di cult to determine. For the interior, an estimate can be made from the results of a blower door test, but this cannot account for wind exposure or other factors.
Tracers in relatively airtight sub oor
For a better result, this BRANZ research configured the subfloor into a relatively airtight state, with total leakage openings equivalent to a single vent of around 200 mm diameter. This is less than the
requirement in NZS 3604:2011 Timber- framed buildings.
A tracer gas was dosed at a constant rate into the space and its concentration change recorded over time. Tracer gas techniques are a powerful way of investigating air movement in buildings. However, the cost and equipment required limits their use to research settings.
Ventilation rate calculations were then made using these concentrations, the tracer
gas dosing rate and the air temperatures in the sub oor and outdoors.
High air change rate needed in sub oor
The measured ventilation rate looks rela- tively high, with a mean of 11.5 air changes per hour at atmospheric pressure (see Figure 1).
However, this is distinct from a blower door test, which is undertaken at an elevated pressure di erence of 50 Pascal.
25
20
15
10
5
0
7 September
21 September
5 October
Figure 1: BRANZ research building sub oor ventilation rates over 1 month.
Build 152 — February/March 2016 — 49
FEATURE SECTION
air changes per hour
