
Page 77 - Build 153
P. 77
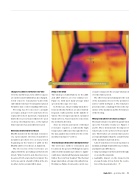
Figure 2: Thermal image of test house with a strong cold southerly blowing.
Changes to sub oor ventilation over time
Over the last 40 years, how sub oor spaces are enclosed and ventilated has also changed. Solid concrete foundation walls with embedded vents have been largely replaced by timber slats or sheet cladding with vents.
Flooring has become more airtight as tongue and groove boards have been replaced by sheet materials. Suspended timber  oors are now more likely to be used on steep sites than  at ones, so the typical wind exposure has generally increased.
Materials monitored in test house
BRANZ monitored the thermal resistance of a representative selection of under oor insulation products for a 2-year period beginning in the winter of 2014 in the BRANZ sub oor test house at Judgeford.
The floor joists of the test house are aligned with the prevailing northwesterly winds. Wind velocity and direction were measured both at ground level under the test house and at a height of 10 m at the site weather station around 20 m away.
Bring on the wind
The wind speed distributions for the 2014 and 2015 winters are very similar (see Figure 1), with most daily average wind speeds in the range 1 to 3 m/s.
In both years, the prevailing wind direc- tion is northerly, but there are also relatively frequent southeasterlies in the middle of winter. The strongest and most sustained winds (above 2.5 m/s) tended to come from the northerly direction.
Since in situ measurement of thermal resistance requires a sufficiently high temperature di erence through the  oor, the data analysis was restricted to the cooler months from June to October.
Thermal image shows where wind penetrated
The test house subfloor orientation and location in the greater Wellington region subjected the insulation products to signi - cantly more wind wash than many suspended timber  oors in New Zealand. The thermal image taken when a strong cold southerly was blowing (see Figure 2) represents a worst-case
scenario compared to the average wind speed over the winter period.
The e ect of air penetrating into the end of the insulation closest to the perimeter joist is visible in Figure 2. The wind also penetrated into a small gap between the top surface of the insulation and the bottom face of the  ooring.
Wind speeds above 1 m/s have an impact
Thermal resistance was plotted against wind speed for 5 months of data (see Figures 3 and 4). These demonstrate the impact of wind wash on two polyester-based prod- ucts. The R-values are system values and so are typically higher than the actual R-value of the insulation material alone.
A short-term burst of very strong wind on medium and high-density  brous products, and rigid foam (EPS) had a:
● temporary impact on the heat  ow through
or around the materials
● negligible impact on the longer-term
average R-value (it was below the resolu- tion of the measurements).
Build 153 — April/May 2016 — 75
