
Page 69 - Build 153
P. 69
Getting to the heart of the numbers
The methodology used in the project works back from a measure of economic return such as cumulative rm pro ts over time. The drivers of pro tability were broken down to identify individual attributes of a rm’s performance and evaluate the relative impor- tance of these.
The impact of a team’s trade and management pro ciencies on these attributes was then considered. Finally, the contribution of training to an individual's pro ciency was weighted relative to the contribution from experience.
Untrained workers will lag
Most business owners involved in the research project agreed that, on average, trained workers become fully pro cient between 6 and 10 years after starting work in the industry (see Figure 1).
On average, untrained workers take much longer to be fully pro cient and will only ever be 60–70% pro cient. Trained workers become fully billable in a much shorter period of time.
In terms of the cost of training an apprentice, the research has taken into account BCITO fees, government’s subsidy for industry training, apprentice salary and the cost of supervising and training an apprentice.
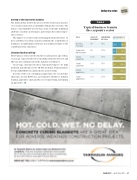
Table 1
Typical business team in the carpentry sector
Industry roles
ROLE
YEARS OF EXPERIENCE
PROPORTION OF TEAM
RESPONSIBILITY MANAGEMENT / TRADE WORK
Business manager
10+
10%
70% / 30%
70% 30%
Supervisor/ job manager
10+
20%
30% / 70%
30% 70%
Senior carpenter
6–10
30%
5% / 95%
5% 95%
Junior carpenter
5–6
10%
0% / 100%
0% 100%
Senior apprentice
2–4
10%
0% / 100%
0% 100%
Junior apprentice
0–2
20%
0% / 100%
0% 100%
Build 153 — April/May 2016 — 67
FEATURE SECTION
