
Page 84 - Build 151
P. 84
Departments/Economy By Ian Page, BRANZ Principal Economist
Employment high
Employment levels in the building industry are at an all-time high, and with more work set to come on stream, they are predicted to rise further. The problem is, these people may be hard to nd.
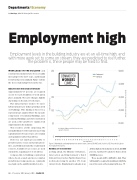
WORKLOADS IN THE BUILDING and construction industry have been steadily increasing for the last 5 years, and demand for labour has risen similarly. Figure 1 shows the close relationship between the two.
Infrastructure work is labour intensive
Approximately 6.5 persons are required on site for each $1 million of work put in place annually. The ratio changes slightly depending on the mix of work types.
Flat infrastructure tends to be more labour intensive per dollar spent than work on buildings. This finding is based on a regression type analysis where the separate components of residential buildings, non- residential buildings and civil construction are used as the variables to explain total employment in the industry.
This result is a little surprising. We normally think of civil construction as being capital intensive because it uses a lot of plant and equipment rather than labour.
However, not much preassembly or prefabrication occurs in flat infrastruc- ture, and bulk materials like ready-mixed concrete, back ll or base course are used extensively, requiring a lot of site labour.
Compare this to building construction where sheets, panels and more complex prefabricated components are commonly used and can be quickly installed on site.
250
200
150
100
50
0
DEMAND FOR
WORKERS
CLIMBS
Employment Workloads
50,000
40,000
30,000
20,000
10,000
0
Includes buildings and at infrastructure capital formation.
88 89 90 91 92 93 94 95 96 97 98 99 00 01 02 03 04 05 06 07 08 09 10 11 12 13 14 15 16
Year end March
Figure 1: Workloads and employment in construction. Source: BRANZ and Statistics NZ Household Labour Force Quarterly Survey.
Numbers set to rise further
Looking ahead, the Ministry of Business, Innovation and Employment’s third National Construction Pipeline Report has workloads rising by another 15% from current levels. Employment is already at an
all-time high in the industry at about 210,000 persons. Another 15% added to this is about 30,000 persons.
These people will be di cult to nd. They will mainly be required in Auckland, which the report forecasts as the main growth area.
82 — December 2015/January 2016 — Build 151
Employment (000s)
Annual workloads ($ million 2015 constant $)
