
Page 63 - Build 151
P. 63
Internal moisture
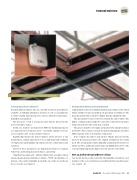
Figure 1: Sensors in the roof measure temperature and humidity.
Collecting input data for simulation
Detailed ambient climate data for a speci c location is generally not available. A building simulation often has to rely on assumptions for time-varying input parameters such as ambient temperature, humidity and radiation.
The rst port of call is averaged yearly climate data from the nearest weather station.
In this case study we used data from NIWA for Auckland prepared as a typical meteorological year le – essentially a number of years are averaged to give a representative dataset.
Equally important is the indoor climate. In the absence of any detailed data, a simple approach is to use a daily sinusoidal oscillation of temperature and humidity superimposed onto a sinusoidal yearly variation.
However, these parameters are hugely dependent on occupant behaviour, and having measured data is a great help.
Using this basic approach – ambient climate from a weather station and an idealised sinusoidal indoor climate – WUFI can simulate, for instance, the relative humidity around the top of the steel rafter in the roof cavity (see Figure 1).
Good agreement between actual and simulated
Comparing the school roof simulated and measured data for the critical winter months reveals reasonably good agreement (see Figure 2). The mean measured value is about 5% higher than the simulated value.
The agreement becomes even better towards the end of winter. The higher readings in June might be caused by construction moisture being released after the cavity was sealed in.
The greater number of troughs and peaks in the simulated data is noticeable. These may be caused by underestimating the moisture bu er capacity of the roof structure components.
If we compare the indoor and outdoor climate data used in the model to the measured values, the original assumptions were fairly good. The average inside relative humidity assumed in the model over winter was 59%, and the measured value was slightly drier at 53%. The corresponding temperature gures were 19° and 17° respectively.
Next up, air ow through di erent ceilings
Our model has been able to predict the humidity around the steel members of the roof construction reasonably well, but some discrepan- cies remain.
Build 151 — December 2015/January 2016 — 61
FEATURE SECTION
